 In this example, we will examine ARMA and ARIMA models with Python using the Statsmodels package. This package can be downloaded at http://statsmodels.sourceforge.net/stable/index.html. Autogressive Moving-Average Processes (ARMA) and Auto-Regressive Integrated Moving Average (ARIMA) can be called from the tsa (Time Series) module from the Statamodels package.
Note: I am not as expert in time-series analysis as I am in other areas of Analytics, so if you find errors I would be happy to know about them and correct them.
Introduction
ARIMA models are, in theory, the most general class of models for forecasting a time series, which can be made to be “stationary” by differencing (if necessary), perhaps in conjunction with nonlinear transformations such as logging or deflating (if necessary). A random variable that is a time series is stationary if its statistical properties are all constant over time. A stationary series has no trend, its variations around its mean have a constant amplitude, and it wiggles in a consistent fashion, i.e., its short-term random time patterns always look the same in a statistical sense. The latter condition means that its autocorrelations (correlations with its prior deviations from the mean) remain constant over time, or equivalently, that its power spectrum remains constant over time. A random variable of this form can be viewed (as usual) as a combination of signal and noise, and the signal (if one is apparent) could be a pattern of fast or slow mean reversion, or sinusoidal oscillation, or rapid alternation in sign, and it could also have a seasonal component. An ARIMA model can be viewed as a “filter” that tries to separate the signal from the noise, and the signal is then extrapolated into the future to obtain forecasts.
The Data
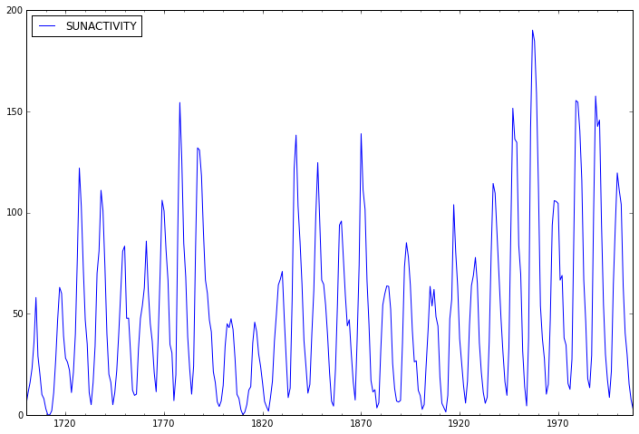
The data we will use is annual sunspot data from 1700 – 2008 recording the number of sunspots per year. The file sunspots.csv and can be downloaded from the line below.
Import Packages
In addition to Statsmodels, we will need to import additional packages, including Numpy, Scipy, Pandas, and Matplotlib.
Also, from Statsmodels we will need to import qqplot.
import numpy as np
from scipy import stats
import pandas as pd
import matplotlib.pyplot as plt
import statsmodels.api as sm
from statsmodels.graphics.api import qqplot
Loading the Dataset
We will use pandas to load the .csv file which we downloaded earlier.
dta= pd.read_csv("C:/Users/Strickland/Documents/Python Scripts/sunspots.csv")
Check the Data Upload
Next we check to see that the data uploaded correctly by viewing the dataset Notes.
print sm.datasets.sunspots.NOTE
Preparing the Data
Next we need to do a little dataset preparation. Here, an annual date series must be date-times at the end of the year.
dta.index = pd.Index(sm.tsa.datetools.dates_from_range('1700', '2008'))
del dta["YEAR"]
Examine the Data
Now we take a look at the data.
# show plots in the notebook
%matplotlib inline
dta.plot(figsize=(12,8));
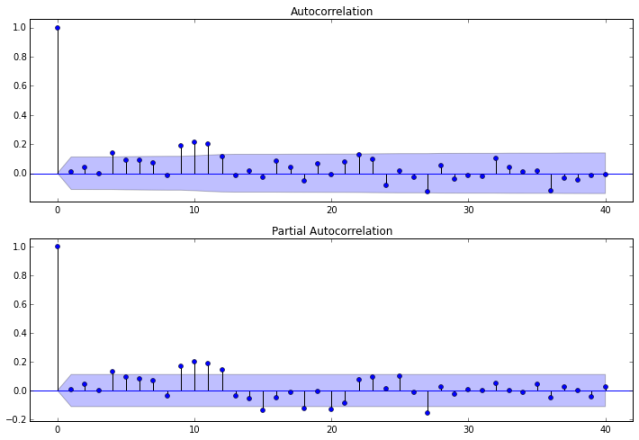
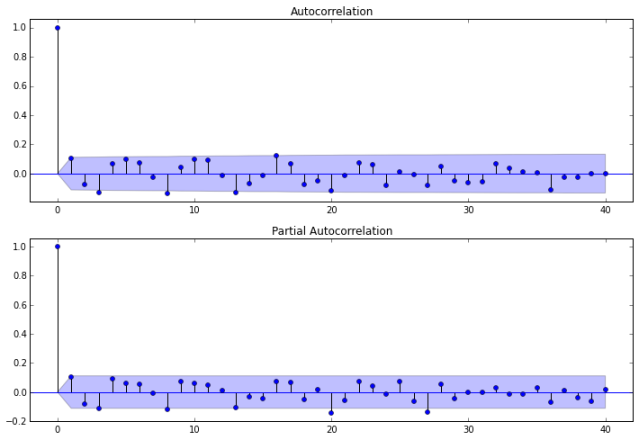
Auto-correlations
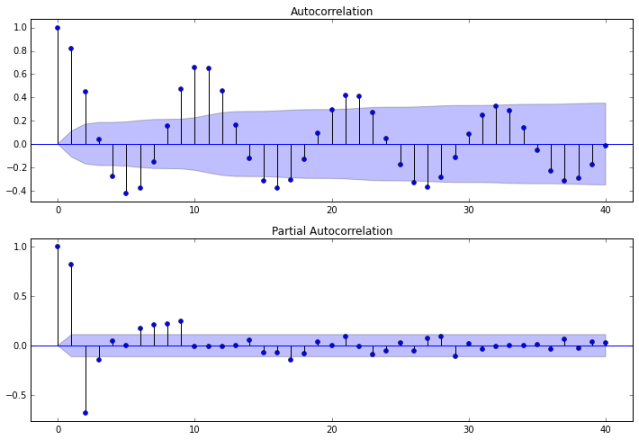
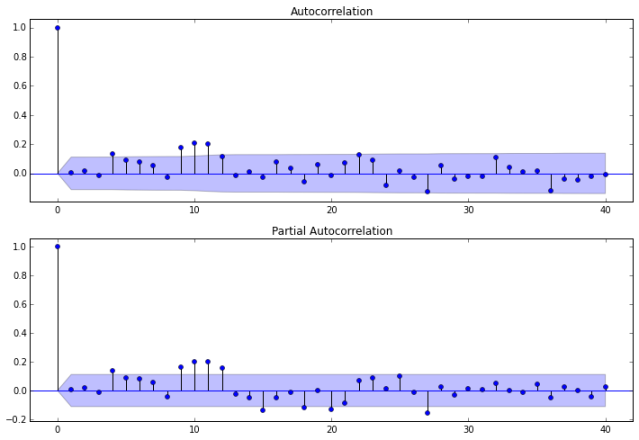
Before we decide which model to use, we need to look at auto-correlations.
Autocorrelation correlogram. Seasonal patterns of time series can be examined via correlograms, which display graphically and numerically the autocorrelation function (ACF). Auto-correlation in pandas plotting and statsmodels graphics standardize the data before computing the auto-correlation. These libraries subtract the mean and divide by the standard deviation of the data.
When using standardization, they make an assumption that your data has been generated with a Gaussian law (with a certain mean and standard deviation). This may not be the case in reality.
Correlation is sensitive. Both (matplotlib and pandas plotting) of these functions have their drawbacks. The figure generated by the following code using matplotlib will be identical to figure generated by pandas plotting or statsmodels graphics.
Partial autocorrelations. Another useful method to examine serial dependencies is to examine the partial autocorrelation function (PACF) – an extension of autocorrelation, where the dependence on the intermediate elements (those within the lag) is removed.
Once we determine the nature of the auto-correlations we use the following rules of thumb.
- Rule 1: If the ACF shows exponential decay, the PACF has a spike at lag 1, and no correlation for other lags, then use one autoregressive (p)parameter
- Rule 2: If the ACF shows a sine-wave shape pattern or a set of exponential decays, the PACF has spikes at lags 1 and 2, and no correlation for other lags, the use two autoregressive (p) parameters
- Rule 3: If the ACF has a spike at lag 1, no correlation for other lags, and the PACF damps out exponentially, then use one moving average (q) parameter.
- Rule 4: If the ACF has spikes at lags 1 and 2, no correlation for other lags, and the PACF has a sine-wave shape pattern or a set of exponential decays, then use two moving average (q) parameter.
- Rule 5: If the ACF shows exponential decay starting at lag 1, and the PACF shows exponential decay starting at lag 1, then use one autoregressive (p) and one moving average (q) parameter.
Removing serial dependency. Serial dependency for a particular lag can be removed by differencing the series. There are two major reasons for such transformations.
- First, we can identify the hidden nature of seasonal dependencies in the series. Autocorrelations for consecutive lags are interdependent, so removing some of the autocorrelations will change other auto correlations, making other seasonalities more apparent.
- Second, removing serial dependencies will make the series stationary, which is necessary for ARIMA and other techniques.
Another popular test for serial correlation is the Durbin-Watson statistic. The DW statistic will lie in the 0-4 range, with a value near two indicating no first-order serial correlation. Positive serial correlation is associated with DW values below 2 and negative serial correlation with DW values above 2.
sm.stats.durbin_watson(dta)
# show plots in the notebook
%matplotlib inline
fig = plt.figure(figsize=(12,8))
ax1 = fig.add_subplot(211)
fig = sm.graphics.tsa.plot_acf(dta.values.squeeze(), lags=40, ax=ax1)
ax2 = fig.add_subplot(212)
fig = sm.graphics.tsa.plot_pacf(dta, lags=40, ax=ax2)
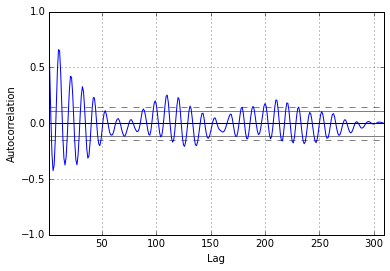
from pandas.tools.plotting import autocorrelation_plot
# show plots in the notebook
%matplotlib inline
dta['SUNACTIVITY_2'] = dta['SUNACTIVITY']
dta['SUNACTIVITY_2'] = (dta['SUNACTIVITY_2'] - dta['SUNACTIVITY_2'].mean()) / (dta['SUNACTIVITY_2'].std())
plt.acorr(dta['SUNACTIVITY_2'],maxlags = len(dta['SUNACTIVITY_2']) -1, linestyle = "solid", usevlines = False, marker='')
plt.show()
autocorrelation_plot(dta['SUNACTIVITY'])
plt.show()

Times Series Modeling
We will only explore two methods here. An ARMA model is classified as ARMA(p,q), with no differenceing terms. ARMA models can be described by a series of equations. The equations are somewhat simpler if the time series is first reduced to zero-mean by subtracting the sample mean. Therefore, we will work with the mean-adjusted series
yt; = Yt – Y̅, t = 1, …N
where Yt is the original time series, Y̅ is its sample mean, and yt is the mean-adjusted series. One subset of ARMA models are the so-called autoregressive, or AR models. An AR model expresses a time series as a linear function of its past values. The order of the AR model tells how many lagged past values are included. The simplest AR model is the first-order autoregressive, or AR(1), model
yt + a1 yt-1 = et
where yt is the mean-adjusted series in year t, yt-1 is the series in the previous year, at is the lag-1 autoregressive coefficient, and et is the noise. The noise also goes by various other names: the error, the random-shock, and the residual. The residuals et are assumed to be random in time (not autocorrelated), and normally distributed. Be rewriting the equation for the AR(1) model as
yt = a1 yt-1 + et
We see that the AR(1) model has the form of a regression model in which yt is regressed on its previous value. In this form, at is analogous to the negative of the regression coefficient, and et to the regression residuals. The name autoregressive refers to the regression on self (auto).
A nonseasonal ARIMA model is classified as an ARIMA(p,d,q) model, where:
- p is the number of autoregressive terms,
- d is the number of nonseasonal differences needed for stationarity, and
- q is the number of lagged forecast errors in the prediction equation.
The forecasting equation is constructed as follows. First, let y denote the dth difference of Y, which means:
If d=0: yt = Yt
If d=1: yt = Yt – Yt-1
If d=2: yt = (Yt – Yt-1) – (Yt-1 – Yt-2) = Yt – 2Yt-1 + Yt-2
Note that the second difference of Y (the d=2 case) is not the difference from two periods ago. Rather, it is the first-difference-of-the-first difference, which is the discrete analog of a second derivative, i.e., the local acceleration of the series rather than its local trend.
Modeling the Data
Model One: ARMA(2,0)
Using Rule 2 from above, we will first try an ARMA(2,0) model with two autoregressive terms and no moving averages.
arma_mod20 = sm.tsa.ARMA(dta, (2,0)).fit()
print arma_mod20.params
print arma_mod20.aic, arma_mod20.bic, arma_mod20.hqic
sm.stats.durbin_watson(arma_mod20.resid.values)
Plotting the Data
Next we plot and study the data it represents.
# show plots in the notebook
%matplotlib inline
fig = plt.figure(figsize=(12,8))
ax = fig.add_subplot(111)
ax = arma_mod20.resid.plot(ax=ax);

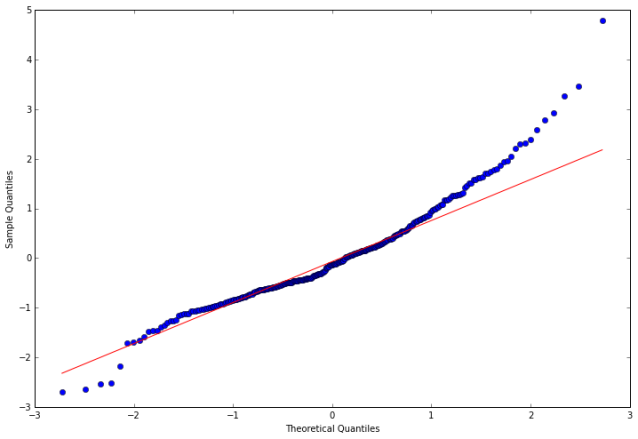
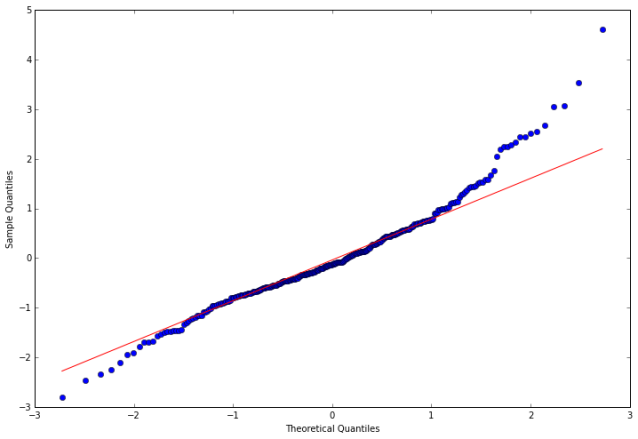
Analyzing the Residuals
In the following steps, we calculate the residuals, tests the null hypothesis that the residuals come from a normal distribution, and construct a qq-plot.
resid20 = arma_mod20.resid
stats.normaltest(resid20)
# show plots in the notebook
%matplotlib inline
fig = plt.figure(figsize=(12,8))
ax = fig.add_subplot(111)
fig = qqplot(resid20, line='q', ax=ax, fit=True)

Model Autocorrelation
Now we investigate the autocorrelation of our ARMA(2,0) model.
%matplotlib inline
fig = plt.figure(figsize=(12,8))
ax1 = fig.add_subplot(211)
fig = sm.graphics.tsa.plot_acf(resid20.values.squeeze(), lags=40, ax=ax1)
ax2 = fig.add_subplot(212)
fig = sm.graphics.tsa.plot_pacf(resid20, lags=40, ax=ax2)
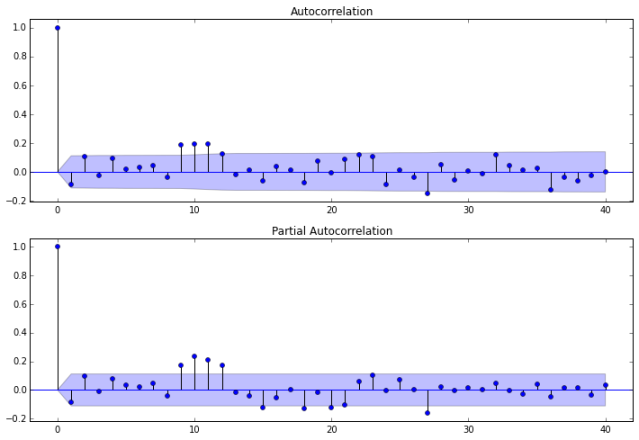
Next, we calculate the lag, autocorrelation (AC), Q statistic and Prob>Q. The Ljung–Box Q test (named for Greta M. Ljung and George E. P. Box) is a type of statistical test of whether any of a group of autocorrelations of a time series are different from zero. The null hypothesis is, H0: The data are independently distributed (i.e. the correlations in the population from which the sample is taken are 0, so that any observed correlations in the data result from randomness of the sampling process).
r,q,p = sm.tsa.acf(resid20.values.squeeze(), qstat=True)
data = np.c_[range(1,41), r[1:], q, p]
table = pd.DataFrame(data, columns=['lag', "AC", "Q", "Prob(>Q)"])
print table.set_index('lag')
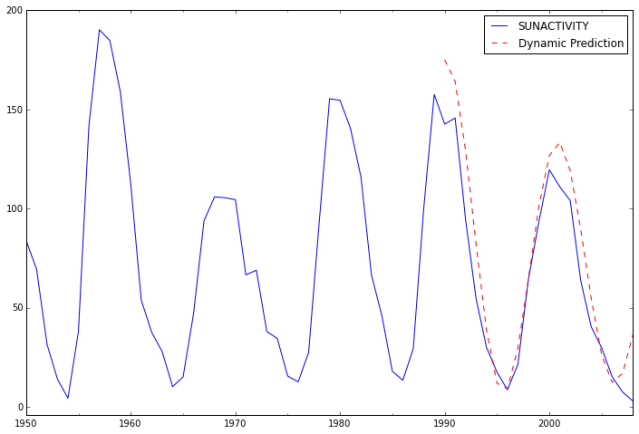
Predictions
Next, we compute the predictions and analyze their fit against actual values.
predict_sunspots20 = arma_mod20.predict('1990', '2012', dynamic=True)
print predict_sunspots20
ax = dta.ix['1950':].plot(figsize=(12,8))
ax = predict_sunspots20.plot(ax=ax, style='r--', label='Dynamic Prediction');
ax.legend();
ax.axis((-20.0, 38.0, -4.0, 200.0));
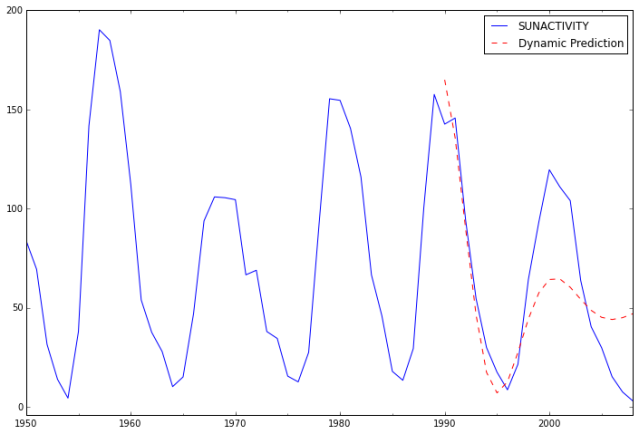
The fit looks good up to about 1998 and underfit the data afterwards.
Calculate Forecast Errors
Mean absolute error: The mean absolute error (MAE) value is computed as the average absolute error value. If this value is 0 (zero), the fit (forecast) is perfect. As compared to the mean squared error value, this measure of fit will “de-emphasize” outliers, that is, unique or rare large error values will affect the MAE less than the MSE value.
Mean Forecast Error (Bias). The mean forecast error (MFE) is the average error in the observations. A large positive MFE means that the forecast is undershooting the actual observations, and a large negative MFE means the forecast is overshooting the actual observations. A value near zero is ideal.
The MAE is a better indicator of fit than the MFE.
def mean_forecast_err(y, yhat):
    return y.sub(yhat).mean()
def mean_absolute_err(y, yhat):
    return np.mean((np.abs(y.sub(yhat).mean()) / yhat)) # or percent error = * 100
print "MFE = ", mean_forecast_err(dta.SUNACTIVITY, predict_sunspots20)
print "MAE = ", mean_absolute_err(dta.SUNACTIVITY, predict_sunspots20)
For MFE > 0, models tends to under-forecast. However, as long as the tracking signal is between –4 and 4, we assume the model is working correctly. The measure of MAE being small would indicate a pretty good fit.
Model Two: ARMA(3,0)
As a second model, we will try an ARMA(3,0) model with three autoregressive terms and no moving averages.
arma_mod30 = sm.tsa.ARMA(dta, (3,0)).fit()
print arma_mod30.params
print arma_mod30.aic, arma_mod30.bic, arma_mod30.hqic
Does our model obey the theory?
sm.stats.durbin_watson(arma_mod30.resid.values)
The Durbin-Watson is lose to 2, so the test shows very little if any positive autocorrelation.
# show plots in the notebook
%matplotlib inline
fig = plt.figure(figsize=(12,8))
ax = fig.add_subplot(111)
ax = arma_mod30.resid.plot(ax=ax);

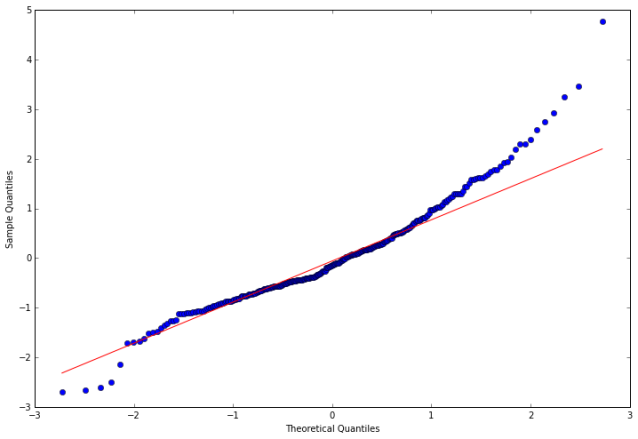
resid30 = arma_mod30.resid
stats.normaltest(resid30)
# show plots in the notebook
%matplotlib inline
fig = plt.figure(figsize=(12,8))
ax = fig.add_subplot(111)
fig = qqplot(resid30, line='q', ax=ax, fit=True)
%matplotlib inline
fig = plt.figure(figsize=(12,8))
ax1 = fig.add_subplot(211)
fig = sm.graphics.tsa.plot_acf(resid30.values.squeeze(), lags=40, ax=ax1)
ax2 = fig.add_subplot(212)
fig = sm.graphics.tsa.plot_pacf(resid30, lags=40, ax=ax2)
r,q,p = sm.tsa.acf(resid30.values.squeeze(), qstat=True)
data = np.c_[range(1,41), r[1:], q, p]
table = pd.DataFrame(data, columns=['lag', "AC", "Q", "Prob(>Q)"])
print table.set_index('lag')
This could indicate a lack of fit. Notice that the p-values for the Ljung–Box Q test all are well above 0.05 for lags 1 through 8, indicating “significance.” This is not a desirable result. However, the p-values for the remaining lags through 40 data values as less than 0.05. So there is much data not contributing to correlations at high lags.
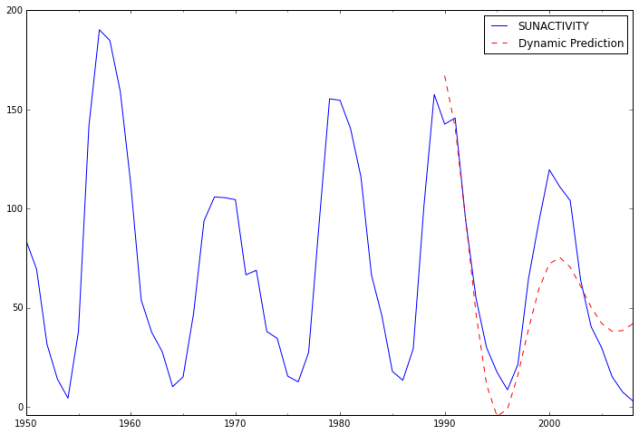
In-sample dynamic prediction. How well does our model do?
predict_sunspots30 = arma_mod30.predict('1990', '2012', dynamic=True)
print predict_sunspots30
ax = dta.ix['1950':].plot(figsize=(12,8))
ax = predict_sunspots30.plot(ax=ax, style='r--', label='Dynamic Prediction');
ax.legend();
ax.axis((-20.0, 38.0, -4.0, 200.0));
print "MFE = ", mean_forecast_err(dta.SUNACTIVITY, predict_sunspots30)
print "MAE = ", mean_absolute_err(dta.SUNACTIVITY, predict_sunspots30)
For small MAE the model is a pretty good fit. The MFE being slightly above 4 might indicate the model tends to under-forecast.
Model Three: ARMA(2,1)
As a third model, we will try an ARMA(2,1) model with two autoregressive terms and one moving average term.
arma_mod40 = sm.tsa.ARMA(dta, (2,1)).fit()
res40 = arma_mod40.resid
print arma_mod40.params
print arma_mod40.aic, arma_mod40.bic, arma_mod40.hqic
sm.stats.durbin_watson(arma_mod40.resid.values)
predict_sunspots40 = arma_mod40.predict('1990', '2012', dynamic=True)
resid40 = arma_mod40.resid
stats.normaltest(resid40)
predict_sunspots40 = arma_mod40.predict('1990', '2012', dynamic=True)
print "Metric for ARMA(2,1): ",mean_forecast_err(dta.SUNACTIVITY, predict_sunspots40),"MFE"
print "Metric for ARMA(2,1): ",mean_absolute_err(dta.SUNACTIVITY, predict_sunspots40),"MAE"
Model Four: ARMA(2,3)
As a fourth model we will try an ARMA(2,3) model with three autoregressive terms and two moving averages.
arma_mod50 = sm.tsa.ARMA(dta, (2,3)).fit()
sm.stats.durbin_watson(arma_mod50.resid.values)
print arma_mod50.params
print arma_mod50.aic, arma_mod50.bic, arma_mod50.hqic
resid50 = arma_mod50.resid
stats.normaltest(resid50)
predict_sunspots50 = arma_mod50.predict('1990', '2012', dynamic=True)
ax = dta.ix['1950':].plot(figsize=(12,8))
ax = predict_sunspots50.plot(ax=ax, style='r--', label='Dynamic Prediction');
ax.legend();
ax.axis((-20.0, 38.0, -4.0, 200.0));

print "Metric for ARMA(3,2): ",mean_forecast_err(dta.SUNACTIVITY, predict_sunspots50),"MLE"
print "Metric for ARMA(3,2): ",mean_absolute_err(dta.SUNACTIVITY, predict_sunspots50),"MAE"
Model Five: ARIMA(3,0,2)
As a fifth model we will try an AIMA(3,0,2) model with three autoregressive terms, no differences, and two moving averages.
arima_mod1 = sm.tsa.ARIMA(dta, (3,0,2)).fit()
print arima_mod1.params
sm.stats.durbin_watson(arima_mod1.resid.values)
print arima_mod1.aic, arima_mod1.bic, arima_mod1.hqic
# show plots in the notebook
%matplotlib inline
fig = plt.figure(figsize=(12,8))
ax = fig.add_subplot(111)
ax = arima_mod1.resid.plot(ax=ax);

resid1 = arima_mod1.resid
stats.normaltest(resid1)
%matplotlib inline
fig = plt.figure(figsize=(12,8))
ax = fig.add_subplot(111)
fig = qqplot(resid1, line='q', ax=ax, fit=True)
%matplotlib inline
fig = plt.figure(figsize=(12,8))
ax1 = fig.add_subplot(211)
fig = sm.graphics.tsa.plot_acf(resid1.values.squeeze(), lags=40, ax=ax1)
ax2 = fig.add_subplot(212)
fig = sm.graphics.tsa.plot_pacf(resid1, lags=40, ax=ax2)
r,q,p = sm.tsa.acf(resid1.values.squeeze(), qstat=True)
data = np.c_[range(1,41), r[1:], q, p]
table = pd.DataFrame(data, columns=['lag', "AC", "Q", "Prob(>Q)"])
print table.set_index('lag')
predict_sunspots1 = arima_mod1.predict('1990', '2012', dynamic=True)
print predict_sunspots1
ax = dta.ix['1950':].plot(figsize=(12,8))
ax = predict_sunspots1.plot(ax=ax, style='r--', label='Dynamic Prediction');
ax.legend();
ax.axis((-20.0, 38.0, -4.0, 200.0));
print "Metrics for ARIMA(3,0,2): ",mean_forecast_err(dta.SUNACTIVITY, predict_sunspots1),"MLE"
print "Metrics for ARIMA(3,0,2): ",mean_absolute_err(dta.SUNACTIVITY, predict_sunspots1),"MAE"
Model Six: ARIMA(2,0,3)
Now let’s examine a sixth model.
arima_mod2 = sm.tsa.ARIMA(dta, (2,0,3)).fit()
print arima_mod2.params
mean_forecast_err(dta.SUNACTIVITY, predict_sunspots30)
print arima_mod2.aic, arima_mod2.bic, arima_mod2.hqic
# show plots in the notebook
%matplotlib inline
fig = plt.figure(figsize=(12,8))
ax = fig.add_subplot(111)
ax = arima_mod2.resid.plot(ax=ax);

resid2 = arima_mod2.resid
stats.normaltest(resid2)
%matplotlib inline
fig = plt.figure(figsize=(12,8))
ax = fig.add_subplot(111)
fig = qqplot(resid2, line='q', ax=ax, fit=True)
%matplotlib inline
fig = plt.figure(figsize=(12,8))
ax1 = fig.add_subplot(211)
fig = sm.graphics.tsa.plot_acf(resid2.values.squeeze(), lags=40, ax=ax1)
ax2 = fig.add_subplot(212)
fig = sm.graphics.tsa.plot_pacf(resid2, lags=40, ax=ax2)
r,q,p = sm.tsa.acf(resid2.values.squeeze(), qstat=True)
data = np.c_[range(1,41), r[1:], q, p]
table = pd.DataFrame(data, columns=['lag', "AC", "Q", "Prob(>Q)"])
print table.set_index('lag')
predict_sunspots2 = arima_mod2.predict('1990', '2012', dynamic=True)
print predict_sunspots2
print "Metrics for ARIMA(2,0,3): ",mean_forecast_err(dta.SUNACTIVITY, predict_sunspots2),"MLE"
print "Metrics for ARIMA(2,0,3): ",mean_absolute_err(dta.SUNACTIVITY, predict_sunspots2),"MAE"
ax = dta.ix['1950':].plot(figsize=(12,8))
ax = predict_sunspots2.plot(ax=ax, style='r--', label='Dynamic Prediction');
ax.legend();
ax.axis((-20.0, 38.0, -4.0, 200.0));

Now let’s compare all six ARMA models using the metrics we have discussed.
print "Model 1: ARMA(2,0)     AIC", arma_mod20.aic, " BIC", arma_mod20.bic, " HQIC", arma_mod20.hqic
print "Model 2: ARMA(3,0)     AIC", arma_mod30.aic, " BIC", arma_mod30.bic, " HQIC", arma_mod30.hqic
print "Model 3: ARMA(2,1)     AIC", arma_mod40.aic, "BIC", arma_mod40.bic, " HQIC", arma_mod40.hqic
print "Model 4: ARMA(2,3)     AIC", arma_mod50.aic, " BIC", arma_mod50.bic, " HQIC", arma_mod50.hqic
print "Model 5: ARIMA(3,0,2)  AIC", arima_mod1.aic, " BIC", arima_mod1.bic, " HQIC", arima_mod1.hqic
print "Model 6: ARIMA(2,0,3)  AIC", arima_mod2.aic, " BIC", arima_mod2.bic, " HQIC", arima_mod2.hqic
print "Metrics for Model 1 ARMA(2,0):    ",mean_forecast_err(dta.SUNACTIVITY, predict_sunspots20)," MFE  ", mean_absolute_err(dta.SUNACTIVITY, predict_sunspots20),"MAE"
print "Metrics for Model 2 ARMA(3,0):    ",mean_forecast_err(dta.SUNACTIVITY, predict_sunspots30)," MFE  ", mean_absolute_err(dta.SUNACTIVITY, predict_sunspots30),"MAE"
print "Metrics for Model 3 ARMA(2,1):    ",mean_forecast_err(dta.SUNACTIVITY, predict_sunspots40)," MFE  ", mean_absolute_err(dta.SUNACTIVITY, predict_sunspots40),"MAE"
print "Metrics for Model 4 ARMA(2,3):    ",mean_forecast_err(dta.SUNACTIVITY, predict_sunspots50)," MFE  ", mean_absolute_err(dta.SUNACTIVITY, predict_sunspots50),"MAE"
print "Metrics for Model 5 ARIMA(3,0,2): ",mean_forecast_err(dta.SUNACTIVITY, predict_sunspots1)," MFE  ", mean_absolute_err(dta.SUNACTIVITY, predict_sunspots1),"MAE"
print "Metrics for Model 6 ARIMA(2,0,3): ",mean_forecast_err(dta.SUNACTIVITY, predict_sunspots2)," MFE  ", mean_absolute_err(dta.SUNACTIVITY, predict_sunspots2),"MAE"
Analysis
Clearly Model 5 minimizes (aic, bic, hqic). However, Model 1 has the smallest MFE and MAE. In terms of consistency, Model 2 minimizes AIC, BIC, HQIC, MFE and MAE. Also, ARIMA(3,0,2) has the lowest AIC, BIC and HQIC values, though it slightly overfits. Notice that ARIMA(2,0,3) and ARMA(2,3) are the same. Why?
Conclusion
Based on the analysis, I would be conservative and choose Model 1, ARMA(2,0), above the other models.
More Experimentation
Now lets build a few model models for comparison. Note we will renumber the models as well.
arma_mod10 = sm.tsa.ARMA(dta, (1,0)).fit()
arma_mod20 = sm.tsa.ARMA(dta, (2,0)).fit()
arma_mod30 = sm.tsa.ARMA(dta, (3,0)).fit()
arma_mod40 = sm.tsa.ARMA(dta, (2,1)).fit()
arma_mod50 = sm.tsa.ARMA(dta, (2,3)).fit()
arima_mod1 = sm.tsa.ARIMA(dta, (3,0,2)).fit()
arima_mod2 = sm.tsa.ARIMA(dta, (2,0,2)).fit()
arima_mod3 = sm.tsa.ARIMA(dta, (1,0,0)).fit()
arima_mod4 = sm.tsa.ARIMA(dta, (0,1,0)).fit()
arima_mod5 = sm.tsa.ARIMA(dta, (0,0,1)).fit()
arima_mod6 = sm.tsa.ARIMA(dta, (1,1,0)).fit()
arima_mod7 = sm.tsa.ARIMA(dta, (0,1,1)).fit()
arima_mod8 = sm.tsa.ARIMA(dta, (1,1,1)).fit()
arima_mod9 = sm.tsa.ARIMA(dta, (3,0,3)).fit()
arima_mod10= sm.tsa.ARIMA(dta, (1,0,6)).fit()
arima_mod11= sm.tsa.ARIMA(dta, (1,0,3)).fit()
We caclualue AIC, BIC, and HQIC.
print "Model 01: ARMA(1,0)     AIC", arma_mod20.aic, " BIC", arma_mod20.bic, " HQIC", arma_mod20.hqic
print "Model 02: ARMA(2,0)     AIC", arma_mod20.aic, " BIC", arma_mod20.bic, " HQIC", arma_mod20.hqic
print "Model 03: ARMA(3,0)     AIC", arma_mod30.aic, " BIC", arma_mod30.bic, " HQIC", arma_mod30.hqic
print "Model 04: ARMA(2,1)     AIC", arma_mod40.aic, "BIC", arma_mod40.bic, " HQIC", arma_mod40.hqic
print "Model 05: ARMA(2,3)     AIC", arma_mod50.aic, " BIC", arma_mod50.bic, " HQIC", arma_mod50.hqic
print "Model 06: ARIMA(3,0,2)  AIC", arima_mod1.aic, " BIC", arima_mod1.bic, " HQIC", arima_mod1.hqic
print "Model 07: ARIMA(2,0,2)  AIC", arima_mod2.aic, " BIC", arima_mod2.bic, " HQIC", arima_mod2.hqic
print "Model 08: ARIMA(1,0,0)  AIC", arima_mod3.aic, " BIC", arima_mod3.bic, " HQIC", arima_mod3.hqic
print "Model 09: ARIMA(0,1,0)  AIC", arima_mod4.aic, " BIC", arima_mod4.bic, " HQIC", arima_mod4.hqic
print "Model 10: ARIMA(0,0,1)  AIC", arima_mod5.aic, " BIC", arima_mod5.bic, " HQIC", arima_mod5.hqic
print "Model 11: ARIMA(1,1,0)  AIC", arima_mod6.aic, " BIC", arima_mod6.bic, " HQIC", arima_mod6.hqic
print "Model 12: ARIMA(0,1,1)  AIC", arima_mod7.aic, " BIC", arima_mod7.bic, " HQIC", arima_mod7.hqic
print "Model 13: ARIMA(1,1,1)  AIC", arima_mod8.aic, " BIC", arima_mod8.bic, " HQIC", arima_mod8.hqic
print "Model 14: ARIMA(3,0,3)  AIC", arima_mod9.aic, " BIC", arima_mod9.bic, " HQIC", arima_mod9.hqic
print "Model 15: ARIMA(1,0,6)  AIC", arima_mod10.aic, " BIC", arima_mod10.bic, " HQIC", arima_mod10.hqic
print "Model 16: ARIMA(1,0,3)  AIC", arima_mod11.aic, " BIC", arima_mod11.bic, " HQIC", arima_mod11.hqic
Now we calculate predictions for each model.
predict_sunspots10 = arma_mod10.predict('1990', '2012', dynamic=True)
predict_sunspots20 = arma_mod20.predict('1990', '2012', dynamic=True)
predict_sunspots30 = arma_mod30.predict('1990', '2012', dynamic=True)
predict_sunspots40 = arma_mod40.predict('1990', '2012', dynamic=True)
predict_sunspots50 = arma_mod50.predict('1990', '2012', dynamic=True)
predict_sunspots1 = arima_mod1.predict('1990', '2012', dynamic=True)
predict_sunspots2 = arima_mod2.predict('1990', '2012', dynamic=True)
predict_sunspots3 = arima_mod3.predict('1990', '2012', dynamic=True)
predict_sunspots4 = arima_mod4.predict('1990', '2012', dynamic=True)
predict_sunspots5 = arima_mod5.predict('1990', '2012', dynamic=True)
predict_sunspots6 = arima_mod6.predict('1990', '2012', dynamic=True)
predict_sunspots7 = arima_mod7.predict('1990', '2012', dynamic=True)
predict_sunspots8 = arima_mod8.predict('1990', '2012', dynamic=True)
predict_sunspots9 = arima_mod9.predict('1990', '2012', dynamic=True)
predict_sunspots10 = arima_mod10.predict('1990', '2012', dynamic=True)
predict_sunspots11 = arima_mod11.predict('1990', '2012', dynamic=True)
Now we calculate MFE and MAE for each model.
print "Metrics for Model 01 ARMA(1,0):    ",mean_forecast_err(dta.SUNACTIVITY, predict_sunspots10)," MFE  ", mean_absolute_err(dta.SUNACTIVITY, predict_sunspots10),"MAE"
print "Metrics for Model 02 ARMA(2,0):    ",mean_forecast_err(dta.SUNACTIVITY, predict_sunspots20)," MFE  ", mean_absolute_err(dta.SUNACTIVITY, predict_sunspots20),"MAE"
print "Metrics for Model 03 ARMA(3,0):    ",mean_forecast_err(dta.SUNACTIVITY, predict_sunspots30)," MFE  ", mean_absolute_err(dta.SUNACTIVITY, predict_sunspots30),"MAE"
print "Metrics for Model 04 ARMA(2,1):    ",mean_forecast_err(dta.SUNACTIVITY, predict_sunspots40)," MFE  ", mean_absolute_err(dta.SUNACTIVITY, predict_sunspots40),"MAE"
print "Metrics for Model 05 ARMA(2,3):    ",mean_forecast_err(dta.SUNACTIVITY, predict_sunspots50)," MFE  ", mean_absolute_err(dta.SUNACTIVITY, predict_sunspots50),"MAE"
print "Metrics for Model 06 ARIMA(3,0,2): ",mean_forecast_err(dta.SUNACTIVITY, predict_sunspots1)," MFE  ", mean_absolute_err(dta.SUNACTIVITY, predict_sunspots1),"MAE"
print "Metrics for Model 07 ARIMA(2,0,2): ",mean_forecast_err(dta.SUNACTIVITY, predict_sunspots2)," MFE  ", mean_absolute_err(dta.SUNACTIVITY, predict_sunspots2),"MAE"
print "Metrics for Model 08 ARIMA(1,0,0): ",mean_forecast_err(dta.SUNACTIVITY, predict_sunspots3)," MFE  ", mean_absolute_err(dta.SUNACTIVITY, predict_sunspots3),"MAE"
print "Metrics for Model 09 ARIMA(0,1,0): ",mean_forecast_err(dta.SUNACTIVITY, predict_sunspots4)," MFE  ", mean_absolute_err(dta.SUNACTIVITY, predict_sunspots4),"MAE"
print "Metrics for Model 10 ARIMA(0,0,1): ",mean_forecast_err(dta.SUNACTIVITY, predict_sunspots5)," MFE  ", mean_absolute_err(dta.SUNACTIVITY, predict_sunspots5),"MAE"
print "Metrics for Model 11 ARIMA(1,1,0): ",mean_forecast_err(dta.SUNACTIVITY, predict_sunspots6)," MFE  ", mean_absolute_err(dta.SUNACTIVITY, predict_sunspots6),"MAE"
print "Metrics for Model 12 ARIMA(0,1,1): ",mean_forecast_err(dta.SUNACTIVITY, predict_sunspots7)," MFE  ", mean_absolute_err(dta.SUNACTIVITY, predict_sunspots7),"MAE"
print "Metrics for Model 13 ARIMA(1,1,1): ",mean_forecast_err(dta.SUNACTIVITY, predict_sunspots8)," MFE  ", mean_absolute_err(dta.SUNACTIVITY, predict_sunspots8),"MAE"
print "Metrics for Model 14 ARIMA(3,0,3): ",mean_forecast_err(dta.SUNACTIVITY, predict_sunspots9)," MFE  ", mean_absolute_err(dta.SUNACTIVITY, predict_sunspots9),"MAE"
print "Metrics for Model 15 ARIMA(1,0,6): ",mean_forecast_err(dta.SUNACTIVITY, predict_sunspots10)," MFE  ", mean_absolute_err(dta.SUNACTIVITY, predict_sunspots10),"MAE"
print "Metrics for Model 16 ARIMA(1,0,3): ",mean_forecast_err(dta.SUNACTIVITY, predict_sunspots11)," MFE  ", mean_absolute_err(dta.SUNACTIVITY, predict_sunspots11),"MAE"
Conclusion
We had assumed from our preliminary data analysis that the model would have at leat 2 autoregression terms. So, we will first examine and compare the models ARMA(2,0), ARMA(2,1), ARMA(2,3) and ARIMA(2,0,3)
Model 14 ARIMA(2,0,3) has relatively good values for AIC, BIC, HQIC, and MAE, but not MFE and underfits (MFE = 5.2779 > 4).
Model 02 ARMA(2,0) has the next best MAE and a relatively good BIC, but slightly underfits (MFE = 4.7303 > 4).
Model 01 ARMA(2,1) and ARMA(2,3) are not as good as ARMA(2,0).
However, look at ARMA(1,0). It has the same AIX, BIC, and HQIC, but it minimizes MFE and MAE.
We choose Model 01 ARMA(1,0) as the best model based on these results. However, I would take the best performing model and plot their prediction and compare them.
 Authored by:
Jeffrey Strickland, Ph.D.
Jeffrey Strickland, Ph.D., is the Author of “Predictive Analytics Using R” and a Senior Analytics Scientist with Clarity Solution Group. He has performed predictive modeling, simulation and analysis for the Department of Defense, NASA, the Missile Defense Agency, and the Financial and Insurance Industries for over 20 years. Jeff is a Certified Modeling and Simulation professional (CMSP) and an Associate Systems Engineering Professional. He has published nearly 200 blogs on LinkedIn, is also a frequently invited guest speaker and the author of 20 books including:
- Discrete Event simulation using ExtendSim
- Crime Analysis and Mapping
- Missile Flight Simulation, Second Edition
- Mathematical modeling of Warfare and Combat Phenomenon
- Predictive Modeling and Analytics
- Using Math to Defeat the Enemy
- Verification and Validation for Modeling and Simulation
- Simulation Conceptual Modeling
Connect with Jeffrey Strickland
Contact Jeffrey Strickland

